
Those of
you who have worked with me in the past know the answer to this
question. "The better tool depends on the problem you are trying to solve."
General
PMAP Thoughts:
For me,
the PMAP is the basis of all problem solving. It is quite simply, a
diagram that you create to show the inputs and outputs to any
process. And yes, everything is a process, so everything can have a
PMAP -- from a librarian cataloging books, to a golfer analyzing their
swing, to building a car.
Are you
trying to reduce the costs in a call center? The output is a
correctly answered question (quality), done in a reasonable time
(cost). The inputs could include (and I am not a call center expert),
computers, phone connections, software to help guide answers, the
operator, their training, etc.
Are you
improving the first time quality of an assembly process? The output
is quality measured by FTQ. The Inputs could include, equipment,
operators, procedures, materials, etc.
PMAPS
can take several forms. The classic linear flow model and the
'swim-lane' model are two commonly used formats for a PMAP.
Classic
PMAP
All
PMAPs show the sequence of tasks which represent the series of steps
in your project’s process. A process map includes steps that are
needed to transform any activity’s inputs into outputs. The classic
PMAP shows the process steps in a linear fashion, from beginning of
your process to the end.
For
example; Process 1 (place part in fixture) --> Process 2 (lower
holding clamp) --> Process 3 (form part). Each of these individual
steps will have inputs (fixture, part, operator, method, electricity)
and outputs (part in fixture, part held secure, part formed to
specification).
From the
PMAP one can analyze how failure of the outputs directly relate to
failure of one or more of the inputs. Using a combination of process
experts, DOEs and Failure Mode Effects analysis, we can quickly begin
to focus on "where to work" to improve our process.
See an
example of a linear PMAP here (credit DMAIC Tools) →
http://www.dmaictools.com/wp-content/uploads/2009/11/flowcharting0002.PNG
Swim
Lane
Swim
Lane Process Maps are practically the same as the classic PMAP, but
it orders the process into "lanes." The Swim Lane shows
the flow of your project through functional groups instead of just
time based. My first step is "specify product" done by
sales or a program team, the second process step is 'design product'
done by Engineering, the third step is "Build Product" done
by Operations, etc.
They use
the same format for showing the Steps, Inputs, and Outputs as regular
PMAPs. They differ only because they arrange the map so the rows
indicate “who” does the process step, e.g., Engineering, Finance,
Purchasing, etc.
See
example here →
https://www.dropbox.com/s/xsup109y6uf6rfo/swim%20lane%20pmap.png
What is
amzing to me is the number of poor examples of process maps and swim
lane PMAPs is seen when one does a Google search. The all show simple
diagrams of process steps, but almost none of them show the inputs
and outputs. No wonder some firms place higher value to Value Stream
mapping over PMAPs. It appears that not many people understand the
power of the PMAP.
Value
Stream Maps
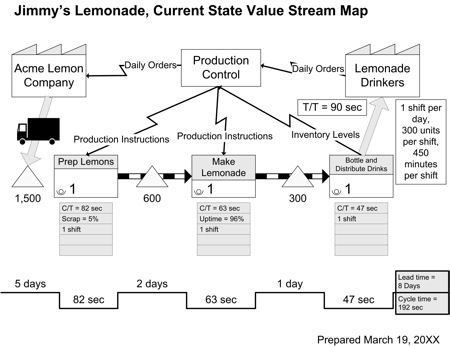
It is my
contention that a Value Stream Map is a sub-set of the Process Map.
As the swim lane PMAP allows us to focus on the cross functional
hand-offs throughout the process, the VSM allows us to focus on flow.
By showing the process in a rough approximation of the actual plant
(or office) layout, our inputs become flow oriented information (time
to perform an operation, time sitting between operations,
information/data flow patterns, materials flow patterns, and others.
The outputs of the VSM are time related data, value added time and
non-value added time. Of course one can also identify other areas of
waste and search for ways to improve the process flow, reduce WIP,
and other items.
See an
example of a VSM here (credit velaction.com ) →
http://www.velaction.com/lean-information/wp-content/uploads/2009/10/value-stream-map-sample.jpg
Summary
If you
are a Six Sigma Black Belt, don't let the question "Are you
familiar with Kaizen events and Value Stream mapping?" throw you off your game. A Kaizen event
is just a term for continuous improvement, but usually focused on
process flow and waste improvement --often through the use of the specialized PMAP
called the Value Stream Map. Of course you should still study this tool and work to create VSMs. They are different and demand some specialized learning.
However, the most
important thing for a Black Belt to understand is that
everything is a process and everything has inputs and outputs. Also that
failures in the inputs directly lead to failures of the outputs and these are the clues we need to solve the problem.
Coming
up soon -- my favorite topic. Comparing data sets that may not be
normal.
Are you
enjoying this blog? Does it seem to have worth? Then pass this link
to your Black Belt friends. Also please post comments below. I am
always looking to improve.
Thanks,
John
No comments:
Post a Comment
Note: Only a member of this blog may post a comment.